Identifier
doi:10.5676/DWD/ESA_Cloud_cci/ATSR2-AATSR/V003
identifierType
DOI
|
Identifier |
|
Title
ESA Cloud_cci cloud property datasets retrieved from passive satellite sensors: ATSR2-AATSR L3C/L3U cloud products - Version 3.0
Description
| The Cloud_cci ATSR2-AATSRv3 dataset (covering 1995-2012) was generated within the Cloud_cci project (http://www.esa-cloud-cci.org) which was funded by the European Space Agency (ESA) as part of the ESA Climate Change Initiative (CCI) programme (Contract No.: 4000109870/13/I-NB). This dataset is one of the 6 datasets generated in Cloud_cci; all of them being based on passive-imager satellite measurements. This dataset is based on ATSR2 and AATSR (onboard ERS2 and ENVISAT) measurements and contains a variety of cloud properties which were derived employing the Community Cloud retrieval for Climate (CC4CL; Sus et al., 2018; McGarragh et al., 2018) retrieval framework. The core cloud properties contained in the Cloud_cci ATSR2-AATSRv3 dataset are cloud mask/fraction, cloud phase, cloud top pressure/height/temperature, cloud optical thickness, cloud effective radius and cloud liquid/ice water path. Spectral cloud albedo is also included as experimental product. The cloud properties are available at different processing levels: Level-3U (globally gridded, unaveraged data fields) and Level-3C (monthly averages and histograms). Pixel-based uncertainty estimates come along with all properties and are also propagated into Level-3C data. More details on the dataset can be found in Poulsen et al. (2020) and in project documentation as listed below. Some examples are shown in Figures 1-3. |
 |  |  |
||
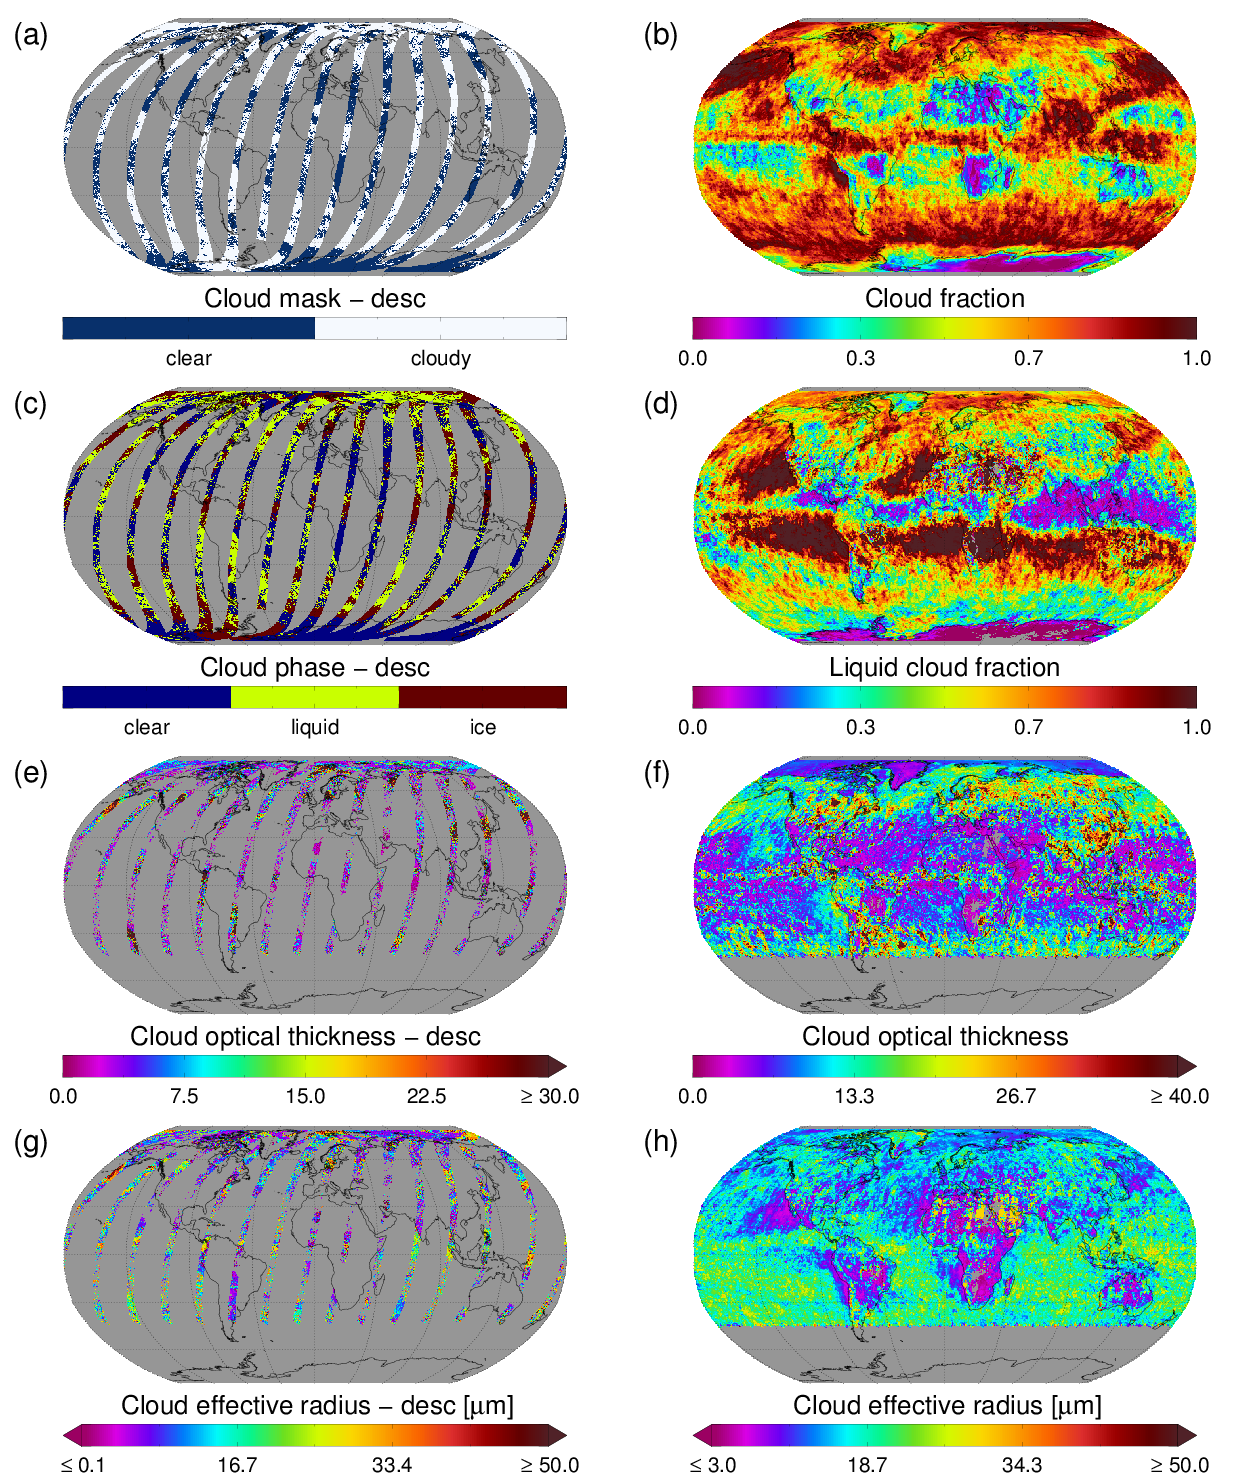
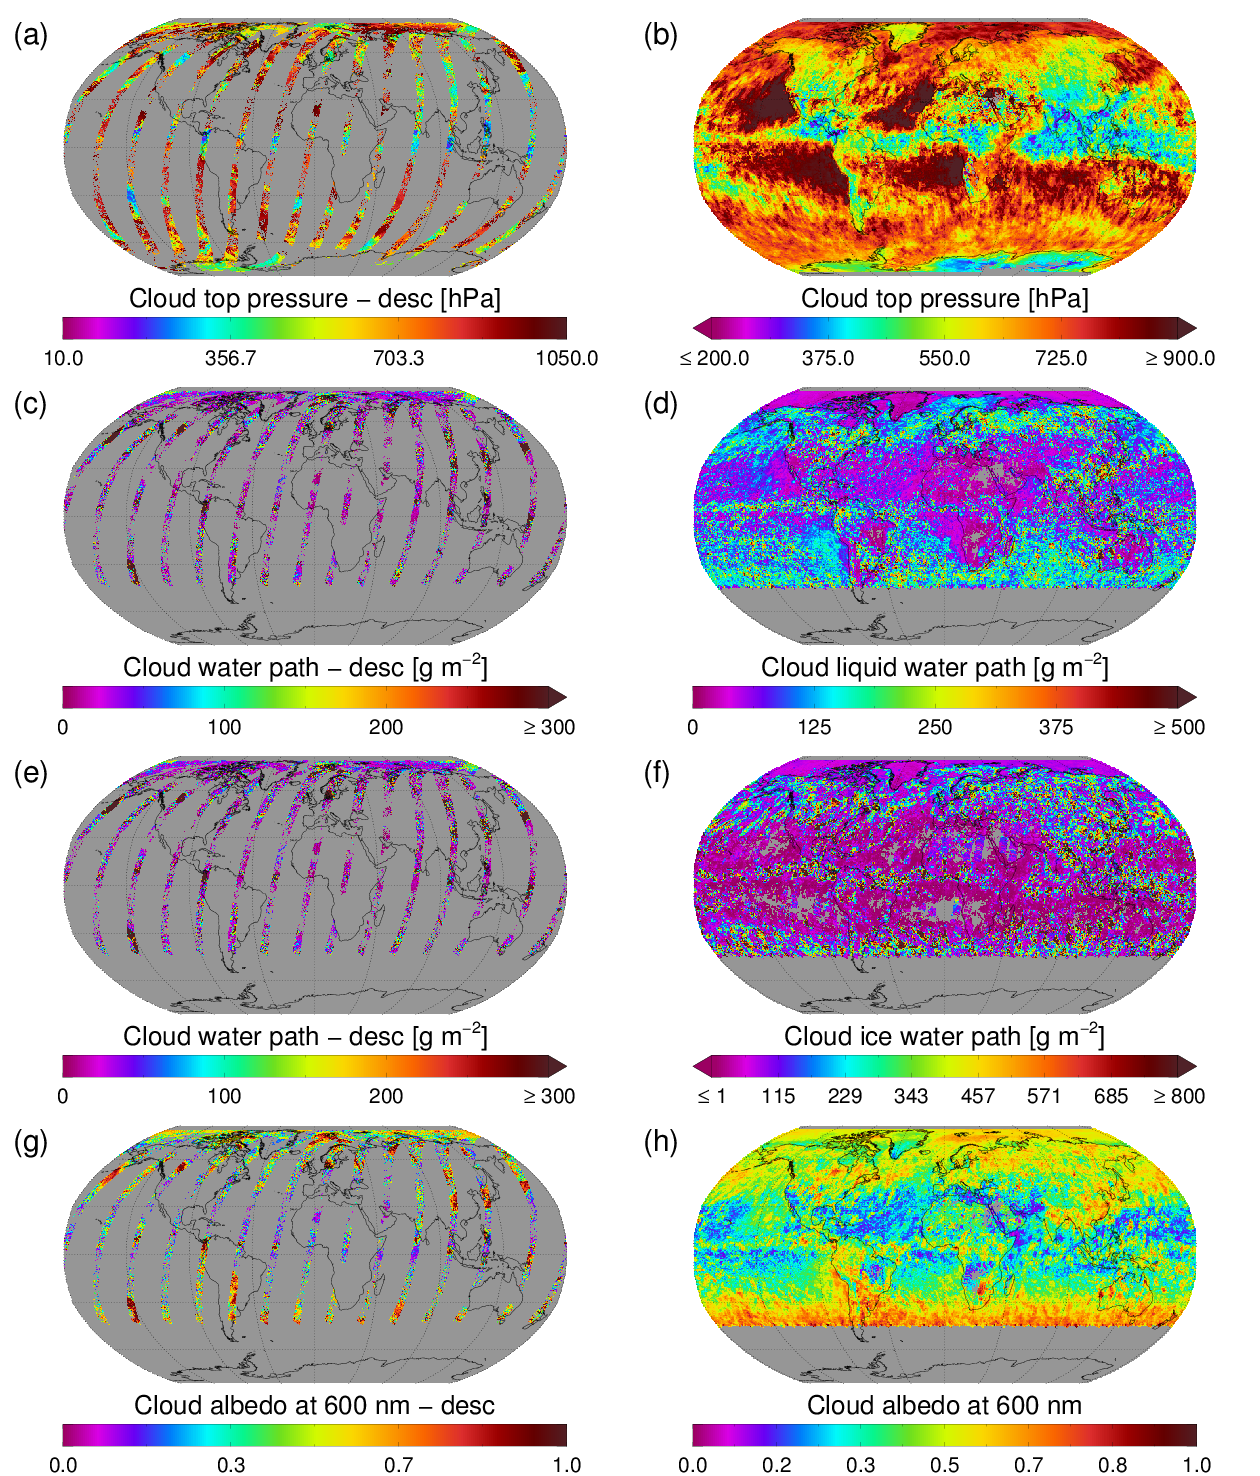
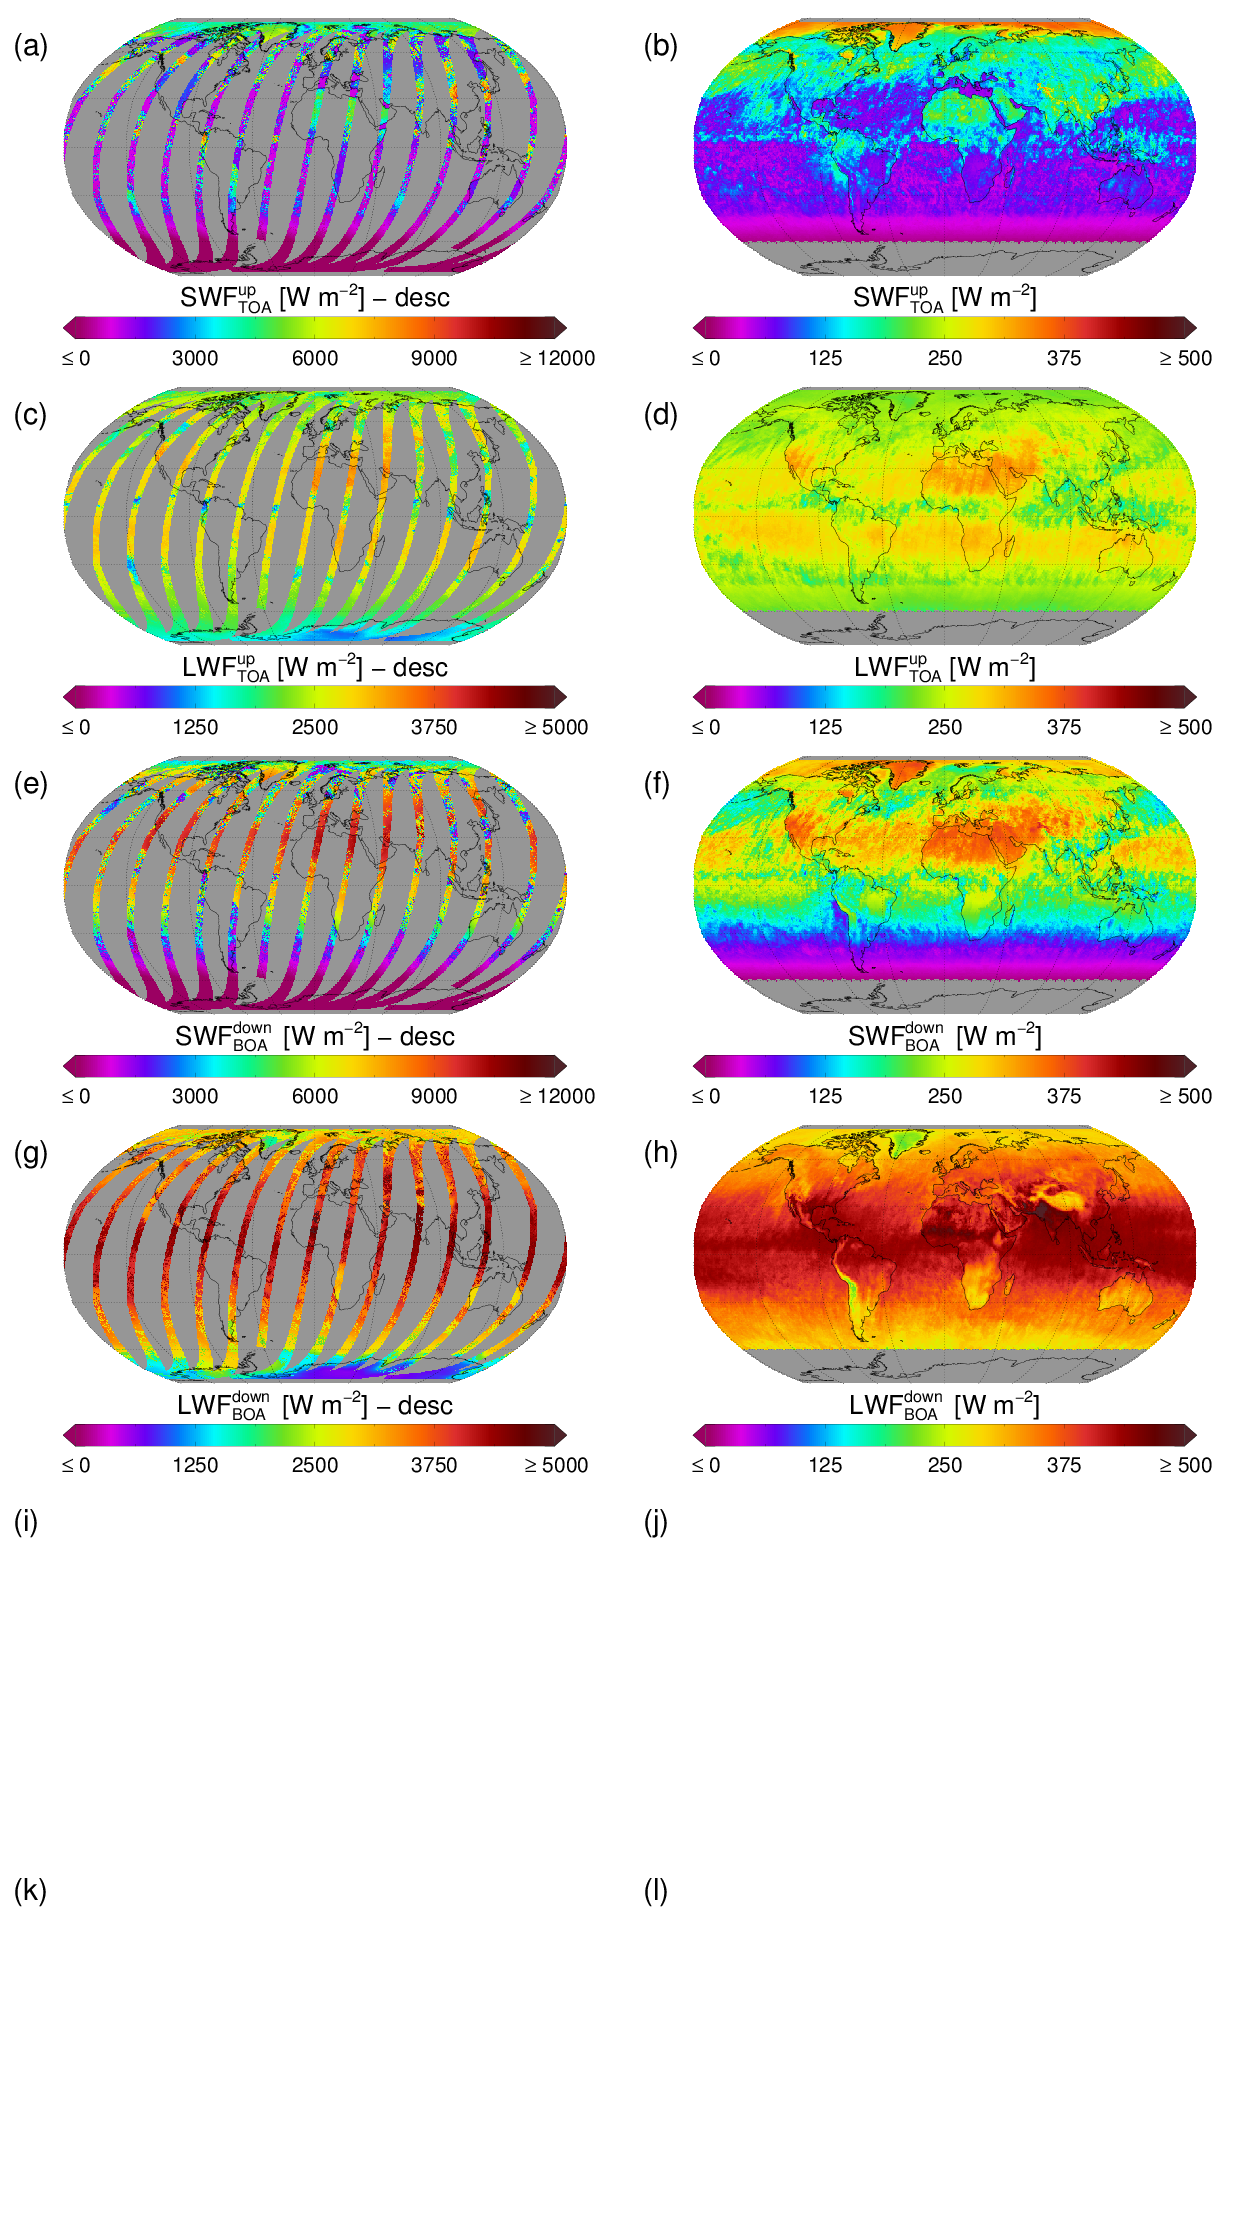
| Figure 1 ATSR2-AATSRv3 Level-3U (a, c, e, g) and Level-3C (b, d, f, h) of cloud mask/fraction (a,b), cloud phase/liquid cloud fraction (c,d), optical thickness (e,f) and effective radius (g,h) for June 2008. For the Level-3U examples, the descending nodes of the orbits are shown, which roughly correspond to the daylight portions of the orbits of Metop-A. COT, LWP, IWP and CLA are only shown during daytime conditions. Areas with no valid retrievals in this day/month are grey-shaded. | Figure 2 ATSR2-AATSRv3 cloud-top pressure (a,b), liquid water path (c,d), ice water path (e,f), and spectral cloud albedo at 0.6 μm (g,h) for Level-3U (a, c, e, g) and Level-3C (b, d, f, h) products. Panels (c) and (e) both show the Level-3U cloud water path, which represents liquid water path in liquid cloud pixels and ice water path in ice cloud pixels. Data is for June 2008. | Figure 3 ATSR2-AATSRv3 upwelling shortwave flux at TOA (a,b), upwelling longwave flux at TOA (c,d), downwelling shortwave flux at BOA (e,f), and downwelling longwave flux at BOA (g,h) for Level-3U (a, c, e, g) and Level-3C (b, d, f, h) products. Data is for June 2008. Panels (i-l) show equivalent data for diffuse and total downwelling photosynthetic radiative flux at BOA. |
Creators
Poulsen, Caroline1; McGarragh, Greg2; Thomas, Gareth1; Stengel, Martin3; Christensen, Matthew1; Povey, Adam2; Proud, Simon2; Carboni, Elisa1; Hollmann, Rainer3; Grainger, Don2
1Rutherford Appleton Laboratory (RAL)
2University of Oxford (UO)
3Deutscher Wetterdienst (DWD)
|
Citation
| Poulsen, Caroline; McGarragh, Greg; Thomas, Gareth; Stengel, Martin; Christensen, Matthew; Povey, Adam; Proud, Simon; Carboni, Elisa; Hollmann, Rainer; Grainger, Don (2019): ESA Cloud Climate Change Initiative (ESA Cloud_cci) data: Cloud_cci ATSR2-AATSR L3C/L3U CLD_PRODUCTS v3.0, Deutscher Wetterdienst (DWD) and Rutherford Appleton Laboratory (Dataset Producer), DOI:10.5676/DWD/ESA_Cloud_cci/ATSR2-AATSR/V003 |